Contractor Stack · Part 29
The Painting Contractor Stack
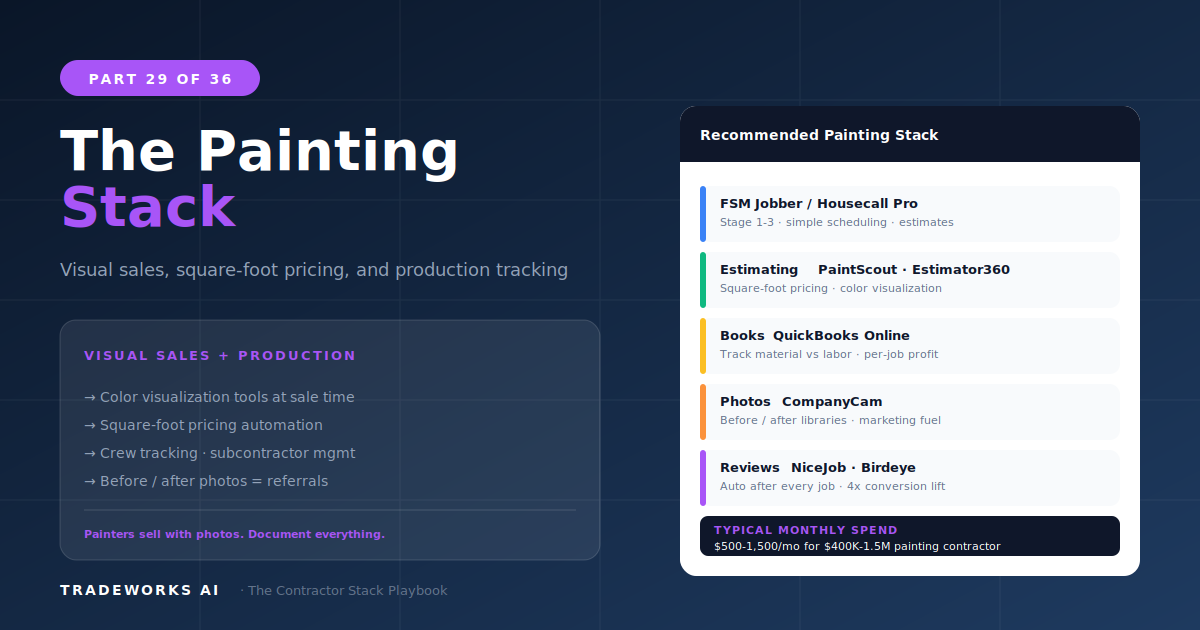
The recommended software stack for a painting contractor at Stage 2–3 ($500K–$1.5M revenue) costs $300 to $700 per month and includes Job...
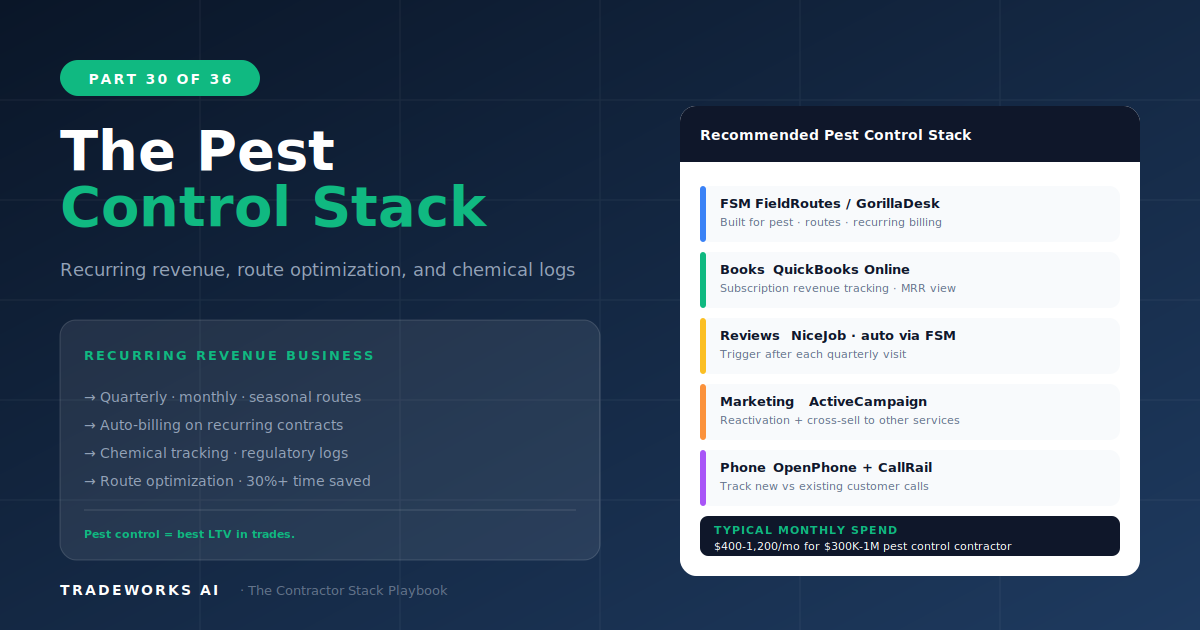
The recommended software stack for a pest control company at Stage 2–3 ($500K–$1.5M revenue) costs $350 to $800 per month and centers on a pest-control-specific platform like PestRoutes or FieldRoutes ($100–$300/month) rather than a general FSM. Pest control businesses differ fundamentally from other trades in this series because revenue is driven by recurring service plans (monthly, bi-monthly, or quarterly treatments), not one-time service calls. The stack must optimize route density for maximum stops per day, automate recurring billing without manual intervention, track chemical applications for regulatory compliance, and manage seasonal demand spikes during Florida’s peak pest seasons (spring and summer for general pest, termite season year-round).
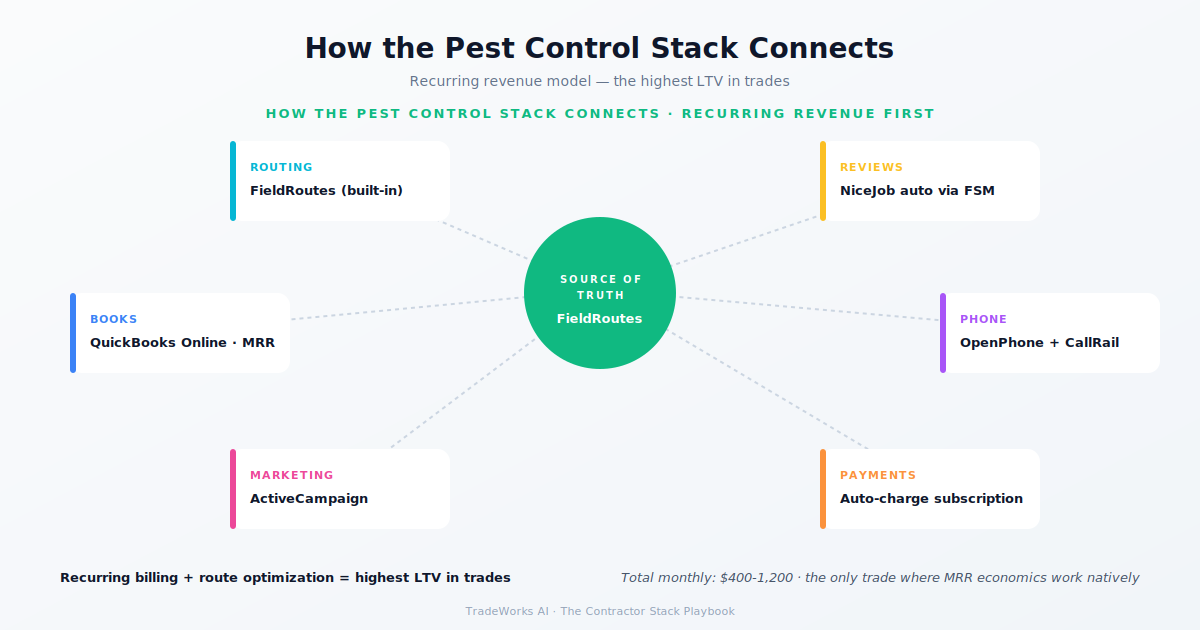
Pest control is a recurring revenue business. While HVAC, plumbing, and electrical generate revenue primarily from one-time service calls and project-based work supplemented by maintenance plans, pest control generates 60 to 80 percent of revenue from recurring service agreements: monthly general pest treatment, quarterly perimeter sprays, annual termite inspections, and ongoing mosquito control programs. This recurring model changes every layer of the stack:
Route optimization is the margin lever: A pest control technician performing 12 to 18 stops per day across a dense geographic route generates significantly more revenue per labor hour than one driving across town for scattered appointments. PestRoutes and FieldRoutes include route optimization that clusters appointments geographically and schedules technicians to minimize drive time between stops. General FSMs dispatch by time slot, not route density.
Automated recurring billing: When 200 to 500 customers are on monthly service plans, manual invoicing is impossible. The platform must automatically bill each customer at the correct interval, process credit card or ACH payments, flag failed payments for follow-up, and manage plan changes (upgrades, downgrades, cancellations) without office staff touching each transaction. PestRoutes and FieldRoutes handle this natively. General FSMs require significant workarounds.
Chemical tracking and compliance: State and federal regulations require pest control companies to document every chemical application: product name, EPA registration number, amount applied, target pest, location, and technician. This data must be retrievable for inspections. Pest-specific platforms include chemical tracking per service. General FSMs do not.
WDO (Wood Destroying Organism) inspections: Florida and many other states require licensed WDO inspections for real estate transactions. These inspections follow a specific format (NPMA-33 form), require separate reporting from general pest service, and are often high-margin one-time services. The platform should track WDO inspections separately from recurring pest control routes.
Seasonal pest marketing: ActiveCampaign campaigns aligned to Florida pest cycles: palmetto bug and ant activity spikes in spring, mosquito season May–October, termite swarm season March–May, rodent activity increase in fall/winter as temperatures drop. Each pest type triggers a different email sequence targeting both prospective and existing customers.
Jobber works for pest control startups handling fewer than 100 recurring customers. The quoting, scheduling, and invoicing cover basic needs. However, Jobber’s lack of route optimization and automated recurring billing means the office manager spends increasing time on manual scheduling and invoicing as the customer base grows. Plan to transition to PestRoutes or FieldRoutes when recurring customers exceed 100. Total: $50–$250/month.
PestRoutes (now part of WorkWave) and FieldRoutes (ServiceTitan’s pest control platform) are the two dominant pest-specific platforms. Both provide route optimization, automated recurring billing, chemical tracking, customer portal access, and service reporting. PestRoutes is the more established option with deeper pest-specific features. FieldRoutes benefits from ServiceTitan’s development resources and is growing feature parity rapidly.
At this stage, NiceJob automates review requests after every service visit (pest control has high service frequency, meaning more review request opportunities per customer than any other trade). ActiveCampaign launches seasonal pest campaigns and plan upgrade promotions. OpenPhone provides the business phone with shared inbox for the office team.
At $1.5M+, pest control companies manage 500+ recurring customers across multiple technicians. Route optimization becomes critical: every unnecessary mile driven between stops reduces margin. PestRoutes and FieldRoutes at the enterprise level provide multi-day route planning, automated rescheduling for missed appointments, and capacity analysis that shows when a geographic area can absorb more customers versus when you need another technician. CompanyCam documents treatment areas and pest activity patterns for customer communication. Trainual standardizes chemical application procedures and safety protocols across all technicians.
Pest control profitability is driven by stops per day per technician. The formula:
Revenue per stop × stops per day × working days = monthly revenue per technician
Example: $45 avg stop × 15 stops/day × 22 days = $14,850/month/technician
With route optimization (18 stops/day): $45 × 18 × 22 = $17,820/month
Difference: $2,970/month per technician from route optimization alone.
For a 5-technician company, route optimization generates an additional $14,850 per month in capacity — against a PestRoutes subscription of $300 to $600 per month. The ROI is 25–50x.
Revenue model: recurring (60–80%) vs one-time service calls. Requires automated billing, not invoice-per-job.
FSM divergence: pest-specific platforms (PestRoutes, FieldRoutes) replace general FSMs at Stage 2, similar to roofing’s divergence to AccuLynx.
Route optimization replaces dispatch optimization as the primary efficiency lever.
Chemical compliance tracking is a regulatory requirement with no equivalent in HVAC, plumbing, or electrical.
Review frequency: monthly service = monthly review opportunities. Pest control can generate more reviews per customer than any other trade.
Customer churn management: recurring models require churn tracking, win-back campaigns, and plan upgrade automation that one-time service businesses do not need.
Using a general FSM past 100 recurring customers. Route optimization and automated billing save more than the general FSM costs. Switch to PestRoutes or FieldRoutes.
Manually billing recurring customers. Every month spent manually processing 200+ invoices costs $500–$1,000 in office labor. Automated billing eliminates this entirely.
Not tracking customer churn. If you do not know your monthly churn rate, you do not know whether your growth is real or just replacing canceled customers. PestRoutes and FieldRoutes report churn. Track it monthly.
PestRoutes or FieldRoutes for any pest control company with 100+ recurring customers. Both provide route optimization, automated recurring billing, chemical tracking, and customer portals that general FSMs like Jobber and Housecall Pro do not offer. For startups under 100 customers, Jobber works as a starting point before transitioning to a pest-specific platform.
Yes. Pest control’s recurring revenue model, route-based operations, chemical compliance requirements, and high-frequency customer contact create stack needs that general FSMs were not designed for. The divergence point is Stage 2: HVAC stays on Housecall Pro while pest control moves to PestRoutes or FieldRoutes.
Route optimization increases stops per day by minimizing drive time between appointments. A 3-stop-per-day improvement at $45 per stop generates $2,970 per month per technician in additional revenue capacity. For a 5-technician company, that is nearly $15,000 per month in additional capacity against $300–$600 in software cost.
Track monthly churn rate in PestRoutes or FieldRoutes. Target below 3% monthly churn. When a customer cancels, trigger an ActiveCampaign win-back sequence: exit survey email, 30-day reconnect offer, 90-day seasonal reminder. Customers who cancel for budget reasons are recoverable with seasonal promotions 3–6 months later.
Most contractors are paying $400–900 per month for software they barely use, while losing thousands more in hidden costs from manual processes and missed callbacks. Our free audit grades your stack against the maturity model and identifies the highest-ROI changes you can make this quarter.
The recommended software stack for a painting contractor at Stage 2–3 ($500K–$1.5M revenue) costs $300 to $700 per month and includes Job...
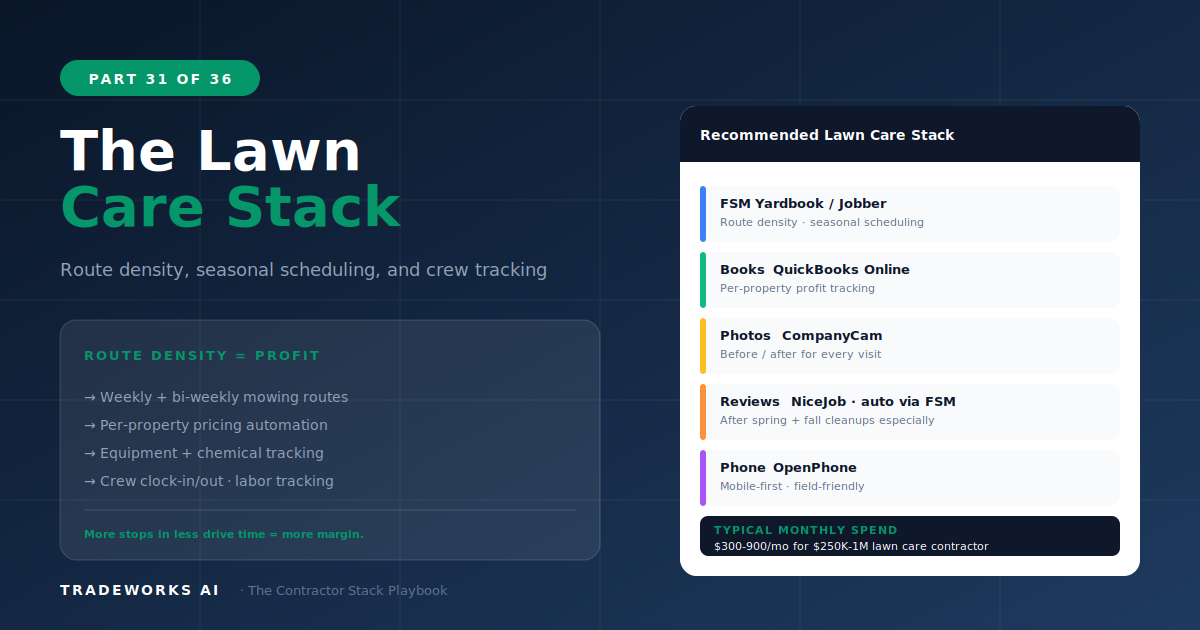
The recommended software stack for a lawn care company at Stage 2–3 ($500K–$1.5M revenue) costs $400 to $1,000 per month and centers on S...