Business Operations · Part 4
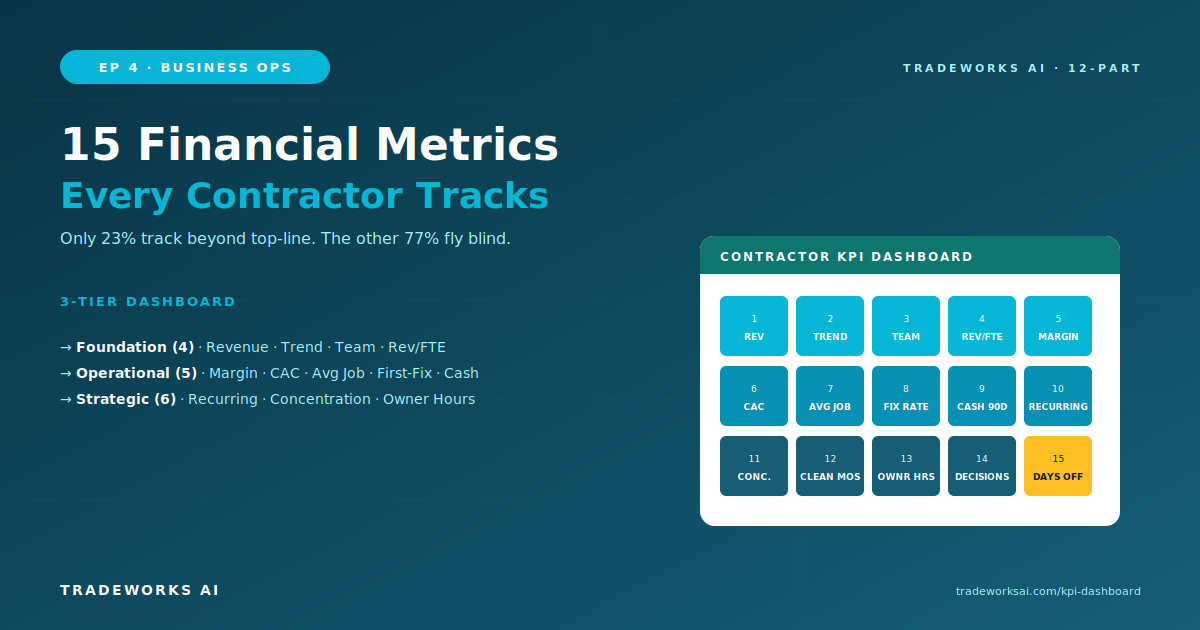
15 Financial Metrics Every Contractor Should Track
Continue the Business Operations series with Part 4 of 12.
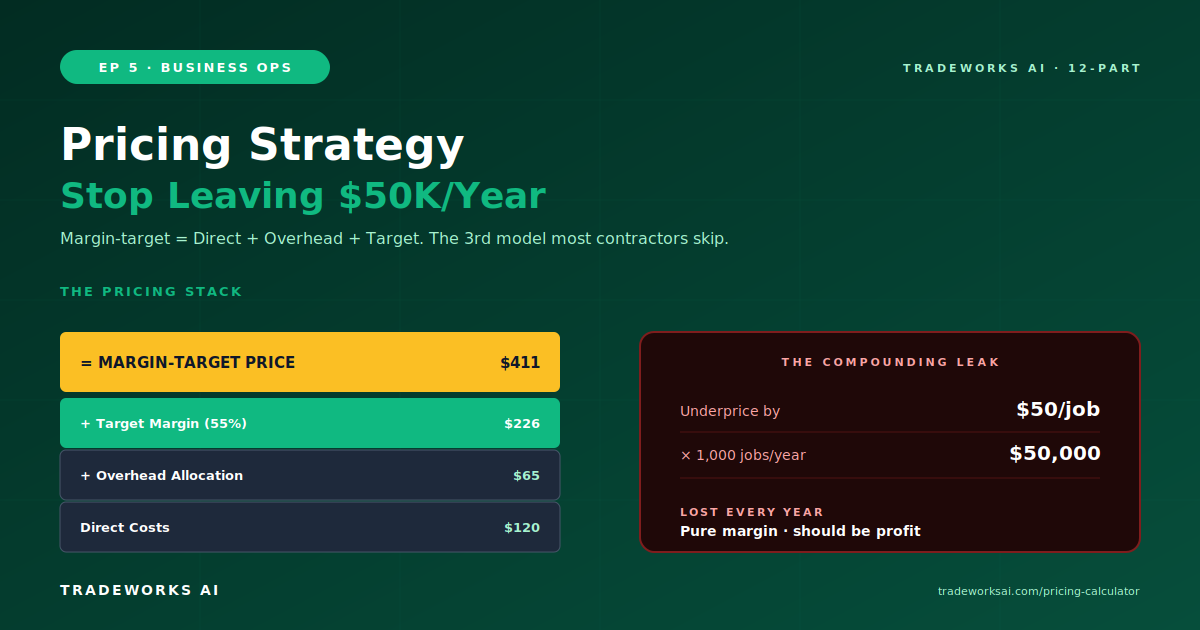
There are three pricing models for contractor businesses: cost-plus (direct costs plus a fixed markup percentage), hourly rate (time and materials billed by the hour), and margin-target (prices set to achieve a specific gross margin by job type). Most contractors use cost-plus or hourly by default because those models are simple. Both leave money on the table. Margin-target pricing starts with Metric 5 from the Contractor KPI Dashboard — Gross Margin by Job Type — and works backward from a target margin to set prices that protect profitability on every job category. The math is straightforward: Direct Costs + Overhead Allocation + Target Margin = Price. A contractor running 1,000 jobs per year who is underpricing by just $50 per job is losing $50,000 annually in margin that should be profit. This guide walks through each model, explains when to use which, provides the pricing stack formula, and includes a free calculator template.
Download the free Pricing Calculator template — plug in your costs and it calculates margin-target prices by job type → tradeworksai.com/pricing-calculator
Most contractors set prices one of two ways: match the competitor down the street, or use a markup they learned from their first boss ten years ago. Neither method accounts for the actual cost structure of the business as it exists today.
The problem compounds silently. A $50 underpricing on a service call doesn’t feel like a problem when the phone is ringing. But a contractor running 1,000 service calls per year at $50 under margin-target is losing $50,000 annually. That’s not revenue — it’s pure margin. Money that should flow to the owner’s pocket, to reinvestment, or to building the operational systems we’ve covered in Parts 1 through 4.
The first step out of the pricing trap is knowing the actual gross margin on each job type. This is Metric 5 from the KPI Dashboard (Part 4). Most contractors who calculate gross margin by job type for the first time discover that installs are running 15–20 margin points below service calls. The discovery itself is the catalyst for repricing.
Each model has a place in a contractor’s operation. The problem is using the wrong model at the wrong stage or for the wrong job type.
Formula: (Materials + Labor) × (1 + Markup %). Typical markups range from 30–65% depending on trade and market. Cost-plus is simple and predictable — every job earns a proportional margin on direct costs.
When to use: project-based work where scope is well-defined and materials are a large percentage of total cost (e.g., HVAC installations, roofing replacements, electrical panel upgrades). Cost-plus works when the cost baseline is accurate.
When it fails: when overhead isn’t factored in. Most contractors apply markup only to materials and direct labor, ignoring truck costs, insurance, software, office rent, and marketing. The result: gross margin looks healthy but net margin is thin or negative because overhead eats the “profit.”
Formula: Hourly Rate × Hours + Materials (at cost or with markup). Typical hourly rates: HVAC $85–$175/hour, plumbing $90–$200/hour, electrical $75–$150/hour depending on market and complexity.
When to use: diagnostic calls, troubleshooting, and situations where scope is uncertain at the start. The customer pays for the time required to solve the problem, not a fixed price that might underestimate complexity.
When it fails: when the technician is fast. A skilled tech who diagnoses and repairs a problem in 30 minutes earns the business half the revenue of a slow tech who takes an hour on the same problem. Hourly billing penalizes efficiency and caps the revenue on every call to a function of time.
Formula: Direct Costs + Overhead Allocation + Target Margin = Price. This model starts with the margin you need to achieve and works backward to set the price. It’s the only model that guarantees every job type meets its profitability threshold.
When to use: every job type, always. Margin-target pricing doesn’t replace cost-plus or hourly as the billing format — it replaces the method for setting what the cost-plus markup or the hourly rate should be. The target margin for each job type comes from Metric 5 (Gross Margin by Job Type) on the KPI Dashboard.
Target margins by job type (contractor industry benchmarks): service calls 55–68%, installations 35–48%, maintenance plans 65–78%, emergency/after-hours 60–75%.
The Pricing Calculator template runs the margin-target formula for all 4 job types. Plug in your costs, set your target margin, get the price → tradeworksai.com/pricing-calculator
The Pricing Stack is the visual formula that turns margin-target pricing into a specific dollar amount per job type. Three layers:
Materials, parts, direct labor (technician wages for time on the job), equipment rental, subcontractor costs. These are costs that exist only because the job exists. If the job didn’t happen, these costs wouldn’t exist.
Truck costs, insurance, software subscriptions, office rent, marketing, admin salaries, uniforms, training, licenses. These exist whether or not any single job happens. The allocation method: total annual overhead divided by total annual jobs. For most contractors this produces an overhead allocation of $35–$85 per job depending on business size and structure.
This layer is where most contractors leak margin. They apply markup to materials and labor but never account for the $50–$85 of overhead that sits on top of every single job. That’s the invisible $50 problem.
The profit target. For a contractor targeting 55% gross margin on service calls, the math is: Price = (Direct Costs + Overhead Allocation) / (1 - Target Margin %). Example: if direct costs are $120 and overhead allocation is $65, and target margin is 55%, then Price = ($120 + $65) / (1 - 0.55) = $185 / 0.45 = $411. That $411 is the minimum price for a service call that achieves the target margin.
Most contractors running this calculation discover their current service call pricing is $30–$80 below the margin-target price. That’s the gap. That’s the $50K per year in lost margin.
The compounding effect of underpricing is invisible at the job level but devastating at the annual level.
A $50-per-job underpricing on 1,000 jobs is $50,000 of margin that should have been profit. That’s the owner’s salary bump. The new truck. The ops manager hire. The marketing budget that produces the next stage of growth. It’s already in the revenue — it’s just leaking out through the pricing.
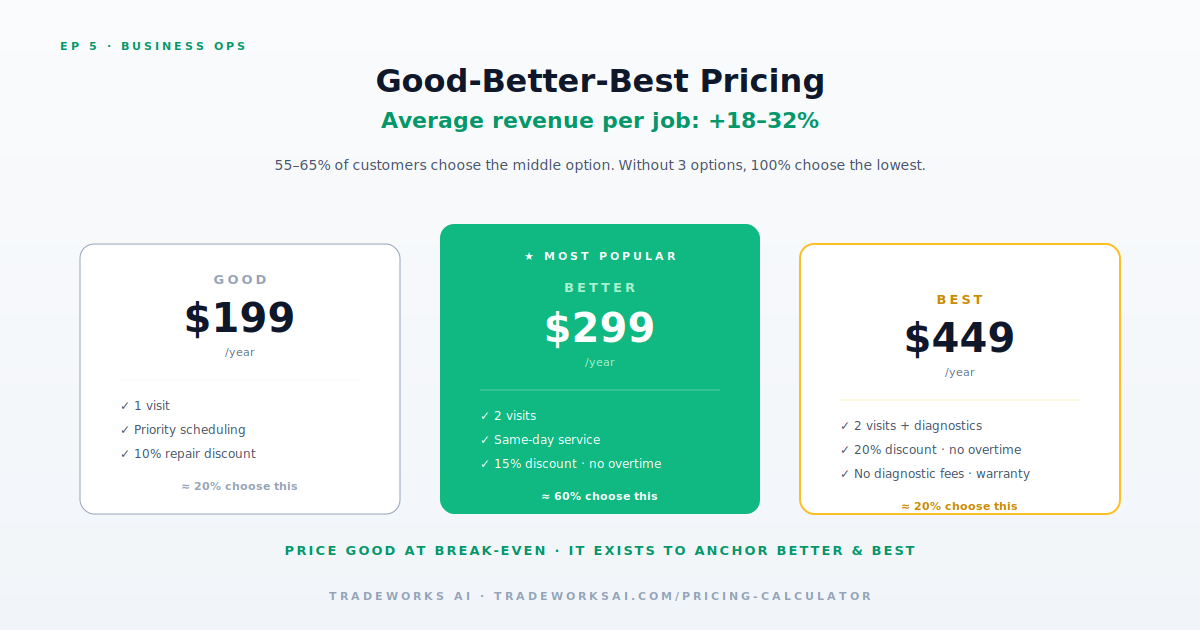
Tiered pricing (Good-Better-Best) is the highest-leverage pricing psychology tactic for contractor businesses. Instead of presenting one option at one price, present three options at three price points.
Good: the baseline repair or solution. Solves the immediate problem. Lowest price. Lowest margin.
Better: the repair plus a preventive component. Includes the baseline plus an add-on that prevents the problem from recurring. Middle price. Higher margin.
Best: the comprehensive solution. Includes the repair, the preventive component, and a maintenance plan enrollment or extended warranty. Highest price. Highest margin.
Industry data shows that when contractors present three options, 55–65% of customers choose the middle option (Better) and 15–25% choose the top option (Best). Without tiered options, 100% choose the single option, which is usually priced at the Good level.
The average revenue per job (Metric 7 from the KPI Dashboard) increases 18–32% after implementing Good-Better-Best. No increase in job volume required. Same number of customers. Higher average ticket.
Most contractors haven’t raised prices in 12–24 months. Costs have risen: insurance, fuel, materials, wages. But prices haven’t moved. The gap compounds every month.
Gross margin by job type has declined 3+ points in 6 months
Revenue per employee is below $130K
The owner is working more hours for the same net income
Material costs have risen 5%+ since last price adjustment
Competitors have raised prices and you haven’t
For existing customers, the conversation is simpler than most owners fear. The script:
“Starting [date], our service rates are adjusting to reflect current material costs, insurance, and the investment we’ve made in technician training and tools. The new rate for [job type] is [new price]. We’re committed to delivering the same quality and responsiveness you’ve come to expect.”
Expected customer loss from a 5–10% price increase: 2–5% of customers. Expected margin recovery: 8–15%. The math almost always favors the increase.
Run the numbers for your business. The Pricing Calculator produces margin-target prices for all 4 job types in under 10 minutes → tradeworksai.com/pricing-calculator
Use Metric 5 from the KPI Dashboard (Part 4). Break revenue into service calls, installs, maintenance, and emergency. Calculate margin for each. Identify which job type is underperforming.
For each job type: Direct Costs + Overhead Allocation + Target Margin = Margin-Target Price. Compare to current pricing. The gap is the lost margin.
For your top 3 most common service calls, build a Good-Better-Best option card. Train technicians to present all three on every call. Track Average Revenue Per Job (Metric 7) for 30 days to measure lift.
Expect 2–5% customer loss on a 5–10% price increase. The margin recovery from the remaining 95–98% more than compensates. A contractor running 1,000 jobs at $50 higher pricing loses 30–50 jobs but gains $47,500–$48,500 in margin. The math consistently favors the increase.
Flat rate for service calls and maintenance (customer knows the price upfront, technician efficiency is rewarded). Time and materials for diagnostics and scope-uncertain work (protects the business from underestimating complex jobs). Both formats can be set using margin-target pricing — the billing format is separate from the pricing method.
Quarterly. Add a pricing review to the Monthly Review Ritual every third month. Compare current prices to margin-target prices, adjust for material and labor cost changes, and update flat rate books accordingly. Most contractors who review quarterly never fall more than 2–3% behind their target.
Depends on job type and trade. Benchmarks: service calls 55–68%, installations 35–48%, maintenance plans 65–78%, emergency 60–75%. Blended gross margin (all job types combined) for a healthy contractor business at Stage 3+: 48–58%. Below 45% blended signals systemic underpricing or cost structure problems.
82% of contractor businesses never break $1M, and most don't know which operational system is missing. Our free audit grades your business against the 5 stages, names the chaos gap blocking you, and identifies the highest-leverage system to build next.
Continue the Business Operations series with Part 4 of 12.

Continue the Business Operations series with Part 6 of 12.