Business Operations · Part 3
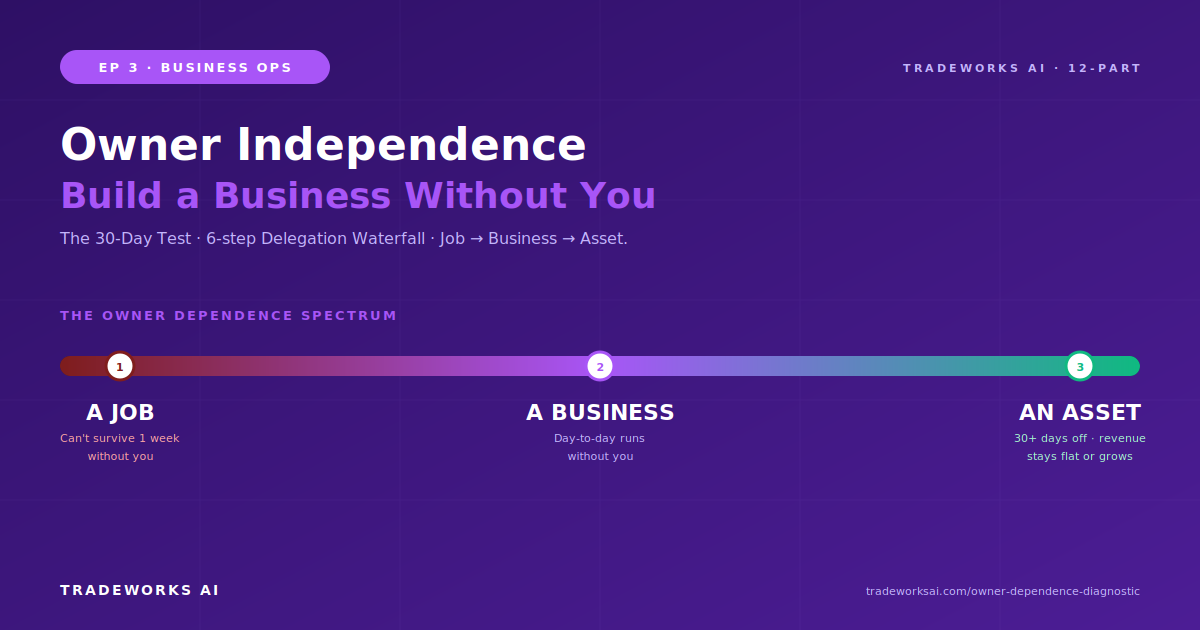
Owner Independence: A Business That Doesn't Need You
Continue the Business Operations series with Part 3 of 12.
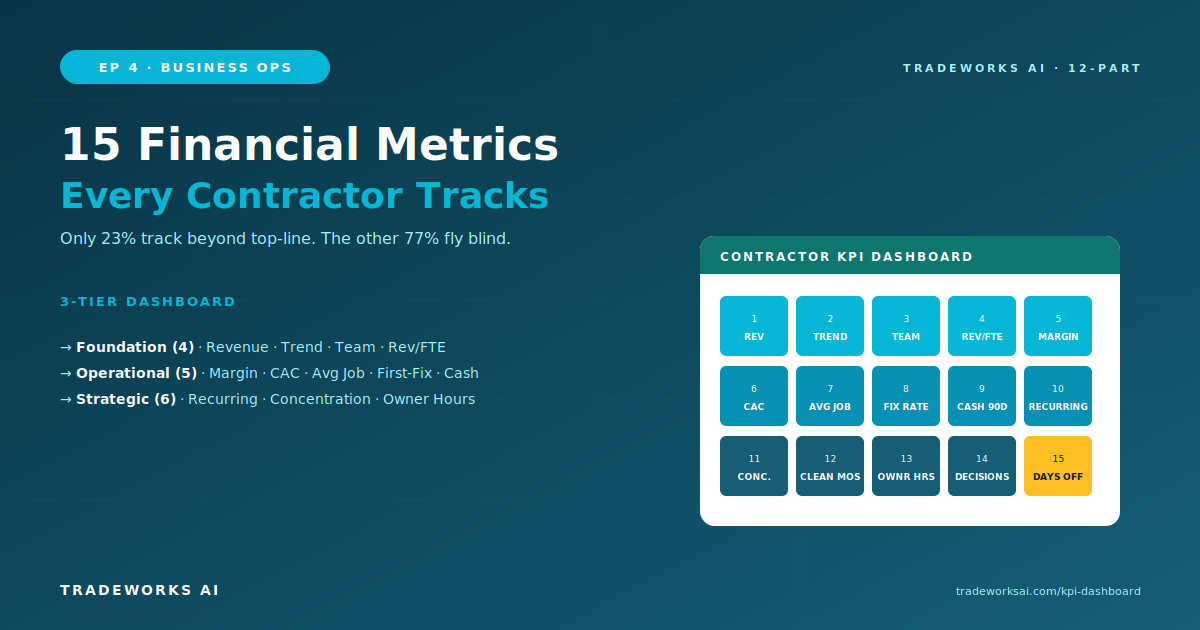
The 15 metrics every contractor should track monthly fall into three tiers. Foundation tier (track from Stage 1): Annual Revenue, Monthly Revenue Trend, Team Size, and Revenue Per Employee. Operational tier (track from Stage 3): Gross Margin by Job Type, Customer Acquisition Cost by Channel, Average Revenue Per Job, First-Time Fix Rate, and 90-Day Cash Flow Forecast. Strategic tier (track from Stage 4): Recurring Revenue Percentage, Top Customer Concentration, Months of Clean Financials, Owner Hours Per Week, Decisions Routed to Owner, and Days Off in Trailing 12 Months. Together, these 15 metrics form the Contractor KPI Dashboard — the operational visibility system that separates contractors who scale from contractors who stall. Most contractor businesses track two metrics: revenue and bank balance. The other 13 are where the real decisions happen.
Download the free Contractor KPI Dashboard template — pre-built with all 15 metrics, formulas, and benchmarks → tradeworksai.com/kpi-dashboard
The 2025 ServiceTitan State of the Trades report found that only 23% of contractor businesses actively track KPIs beyond top-line revenue. The remaining 77% make staffing, pricing, marketing, and expansion decisions based on gut feeling, bank balance, and last month’s best guess.
Gut feeling works at Stage 1 because the owner sees every transaction. It breaks at Stage 3 because the volume exceeds what one person can track. The $500K contractor who doesn’t know their gross margin by job type is leaking money on every install. The $1.5M contractor who doesn’t know their customer acquisition cost by channel is overspending on the wrong marketing. Both feel busy. Neither know where the profit actually comes from.
The KPI Dashboard doesn’t just measure the business — it reveals the business. Every metric tells a story, and most of those stories are invisible without data.
Not all 15 metrics matter at every stage. The pyramid has three tiers, and each tier unlocks at a specific revenue stage. Trying to track all 15 at Stage 1 produces overwhelm. Tracking only 4 at Stage 4 produces blindness. Match the tier to the stage.
These are the four metrics every contractor business should track from Day 1. They require nothing more than a bookkeeper and a headcount.
1. Annual Revenue — trailing 12-month total, recalculated monthly. Not last month annualized, not a projection, not the best quarter times four. The honest trailing 12-month number. This is the metric that determines which stage of the staircase the business is on (Part 1).
2. Monthly Revenue Trend — rolling 6-month chart showing growth direction. A flat or declining trend at Stage 3 means the business is stalling in the chaos gap. An accelerating trend at Stage 2 means the business is approaching the hiring threshold. The direction matters more than the number.
3. Team Size — total headcount including subcontractors counted as full-time equivalents (FTEs). This number paired with revenue determines stage position: $1.2M revenue with 3 techs looks different than $1.2M with 8 techs. The ratio reveals operational efficiency or bloat.
4. Revenue Per Employee — annual revenue divided by FTE count. Healthy contractor businesses run $130K–$200K revenue per employee depending on trade and market. Below $100K signals overstaffing, inefficient routing, or pricing problems. Above $200K signals the business may be under-staffed and leaving revenue on the table.
These five metrics become critical at the multi-crew stage when volume exceeds what the owner can track by feel. They require a field service management tool (ServiceTitan, Housecall Pro, Jobber) and monthly bookkeeper reviews.
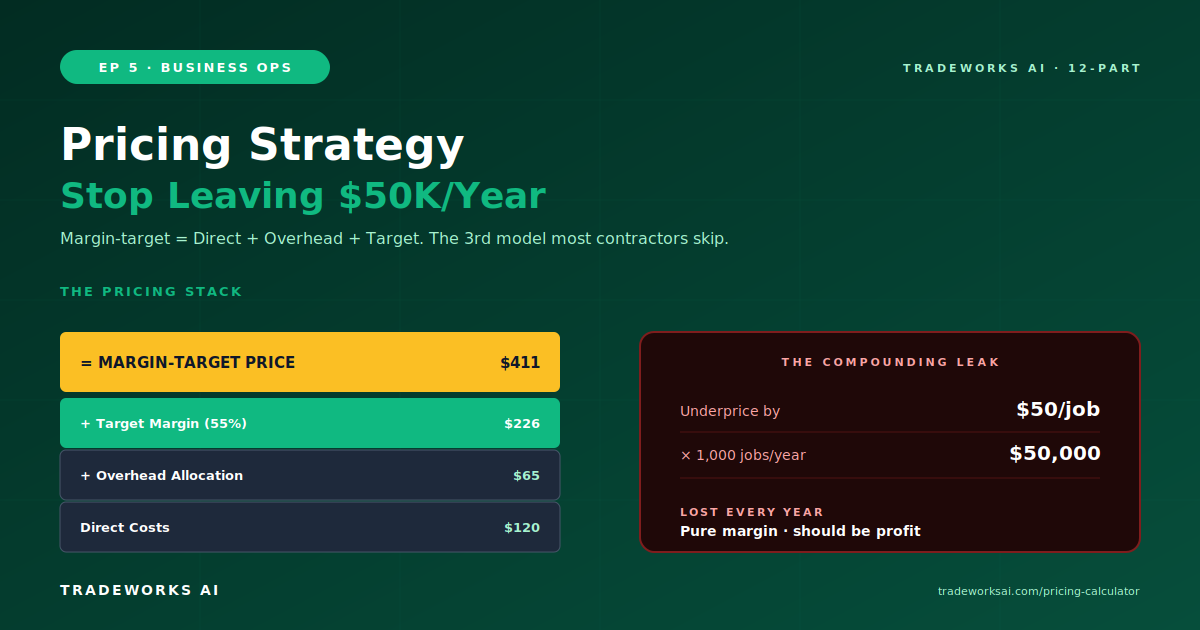
5. Gross Margin by Job Type — the single most important metric most contractors don’t track. Break revenue into four categories: service calls, installations, maintenance plans, and emergency/after-hours. Calculate gross margin (revenue minus direct costs including labor, materials, and equipment) for each category separately. Most contractors discover that one job type is significantly more profitable than the others — and they’ve been underpricing it.
6. Customer Acquisition Cost (CAC) by Channel — total marketing spend per channel divided by new customers from that channel. Channels: Google Ads, Facebook Ads, SEO/organic, referrals, Nextdoor, Angi/HomeAdvisor, direct mail. Most contractors spend 60% of their marketing budget on the channel that produces 20% of new customers. CAC by channel reveals that imbalance immediately.
7. Average Revenue Per Job — total revenue divided by total jobs completed. Track monthly. A declining average revenue per job at stable volume means the business is doing more work for less money — a margin compression signal. An increasing average means higher-value work or successful upselling.
8. First-Time Fix Rate — percentage of jobs resolved on the first visit without a callback or return trip. Industry benchmark for HVAC: 85–92%. Plumbing: 88–95%. Electrical: 90–96%. Below benchmark means truck stocking problems, diagnostic training gaps, or parts availability issues. Every return trip is a direct cost and a customer satisfaction hit.
9. 90-Day Cash Flow Forecast — projected cash position for the next 90 days based on booked work, maintenance plan renewals, accounts receivable, and recurring expenses. This is the metric that prevents the most common cause of contractor business failure: cash flow mismanagement. Revenue can be growing while cash is shrinking if AR collection is slow and expenses are front-loaded.
The KPI Dashboard template includes pre-built formulas for all 15 metrics, benchmarks by trade, and a monthly review checklist → tradeworksai.com/kpi-dashboard
These six metrics measure sellability, owner independence, and long-term asset value. They were introduced in Parts 2 and 3 as part of the 5-Pillar Scorecard and the Owner Dependence Spectrum. They’re included here because the KPI Dashboard is the single place where all 15 metrics live.
10. Recurring Revenue Percentage — monthly recurring revenue (maintenance plans, contracts) divided by total monthly revenue. Target: 25%+ (Part 2, Pillar 2).
11. Top Customer Concentration — largest customer’s revenue divided by total revenue. Target: under 15% (Part 2, Pillar 4).
12. Months of Clean Financials — consecutive months of bookkeeper-reviewed P&Ls. Target: 36+ months for sale-readiness (Part 2, Pillar 5).
13. Owner Hours Per Week — self-tracked time spent on the business. Target: under 35 hours by Stage 4 (Part 3).
14. Decisions Routed to Owner — weekly count of operational, technical, financial, and customer decisions requiring owner involvement. Target: under 10/week (Part 3).
15. Days Off in Trailing 12 Months — actual days fully disconnected. Target: 30+ (Part 3).
The dashboard works in three tools depending on the stage and tech comfort of the business. The downloadable template works in all three.
Google Sheets or Excel — the simplest option. Works for Stage 1–3 businesses. Manual data entry monthly. The template includes formulas and conditional formatting.
Notion — for owners who want a centralized operations hub. The template includes the dashboard as a Notion database with rollup calculations.
ServiceTitan or Housecall Pro reporting — for Stage 3+ businesses using field service management software. Most Tier 2 metrics can be pulled directly from the platform’s built-in reporting. The template maps each metric to the specific report in ServiceTitan and Housecall Pro.
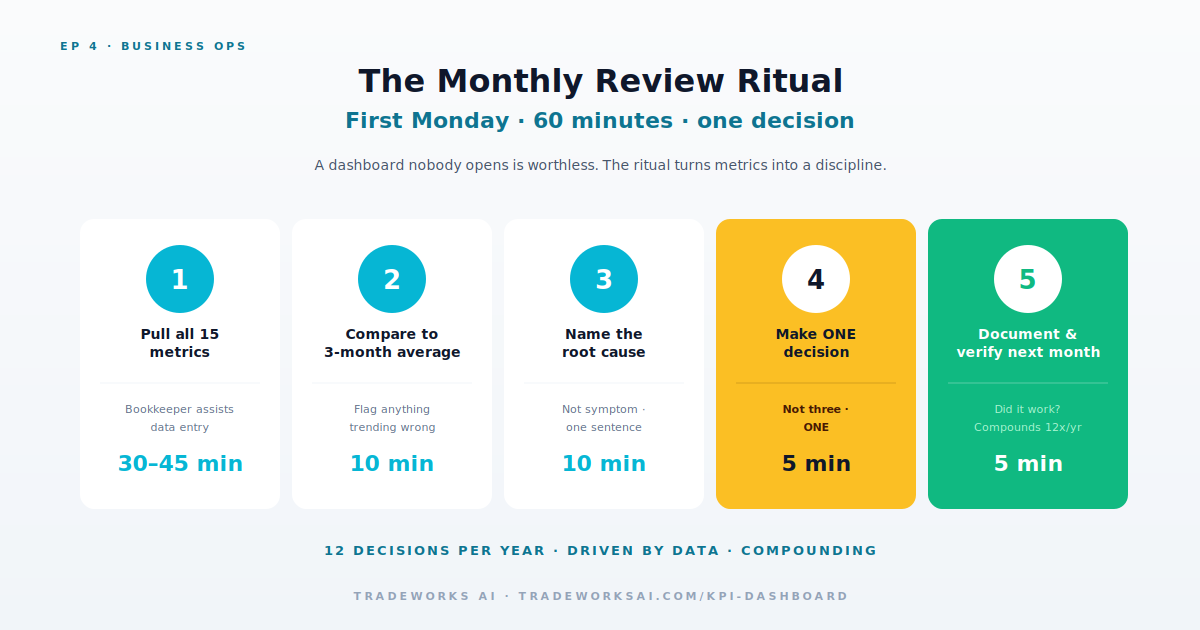
Regardless of tool, the rhythm is the same: review the dashboard on the first Monday of every month. Block 60 minutes. Pull the numbers. Note the trends. Make one operational decision based on what the data shows. One decision per month, driven by data, compounding over 12 months.
The dashboard is worthless if it sits in a spreadsheet and nobody looks at it. The Monthly Review Ritual turns the dashboard from a document into a discipline.
Step 1: Pull all 15 metrics (or the tier-appropriate subset) into the dashboard. Time: 30–45 minutes with a bookkeeper.
Step 2: Compare each metric to the prior month and the 3-month rolling average. Identify any metric moving in the wrong direction.
Step 3: For each declining metric, name the root cause in one sentence. Not “revenue is down” — that’s the symptom. “Average revenue per job dropped 12% because we took on 14 low-margin emergency calls at the old pricing” — that’s the cause.
Step 4: Make ONE operational decision based on the data. Change one thing. Implement it before the next review. Don’t change three things — that makes it impossible to attribute the result.
Step 5: Document the decision and the expected result. At the next monthly review, check whether the intervention worked.
Download the free KPI Dashboard template with all 15 metrics, benchmarks, and the Monthly Review checklist → tradeworksai.com/kpi-dashboard
These benchmarks represent healthy contractor businesses at Stage 3 or above. Adjust for market, geography, and business model.
With a bookkeeper handling data entry, the owner’s review takes 30–45 minutes per month. The first review takes 90–120 minutes because the metrics need to be set up and validated. After the first month, it’s a routine pull-and-review process that gets faster each time.
The Foundation tier (4 metrics) can be tracked by the owner alone using QuickBooks Online and a headcount. The Operational tier (5 metrics) requires either a bookkeeper or a field service management tool that generates the reports automatically. If the business is at Stage 3 without a bookkeeper, the first action item is hiring one — $400–$800 per month for a part-time bookkeeper is the single highest-ROI investment at that stage.
Gross Margin by Job Type. It’s the metric most contractors don’t track and the one that produces the most immediate impact when they start. Most contractors discover that one job type (usually installations) is significantly less profitable than they assumed, while another (usually maintenance plans) is significantly more profitable. That single discovery changes pricing, scheduling, and marketing allocation.
No. Match the tier to your stage. Stage 1–2: track the Foundation tier (4 metrics). Stage 3: add the Operational tier (9 total). Stage 4+: add the Strategic tier (all 15). Trying to track all 15 at Stage 1 produces overwhelm and no action. Starting with 4 and building up produces clarity and momentum.
SDE = Net Income + Owner’s Salary + Owner’s Benefits + Depreciation + Amortization + Interest + One-Time Non-Recurring Expenses. The bookkeeper or accountant calculates this from the annual P&L. SDE is the profit figure that buyers use to apply the sellability multiple (Part 2). If you don’t know your SDE, the Financial Clarity pillar scores 1–3.
82% of contractor businesses never break $1M, and most don't know which operational system is missing. Our free audit grades your business against the 5 stages, names the chaos gap blocking you, and identifies the highest-leverage system to build next.
Continue the Business Operations series with Part 3 of 12.
Continue the Business Operations series with Part 5 of 12.