Google Ads · Part 1
Google Ads for Contractors: The Real Cost, the Real Math, and How to Know If It’s Working (2026)
Continue the Google Ads Playbook with Part 1 of 10.
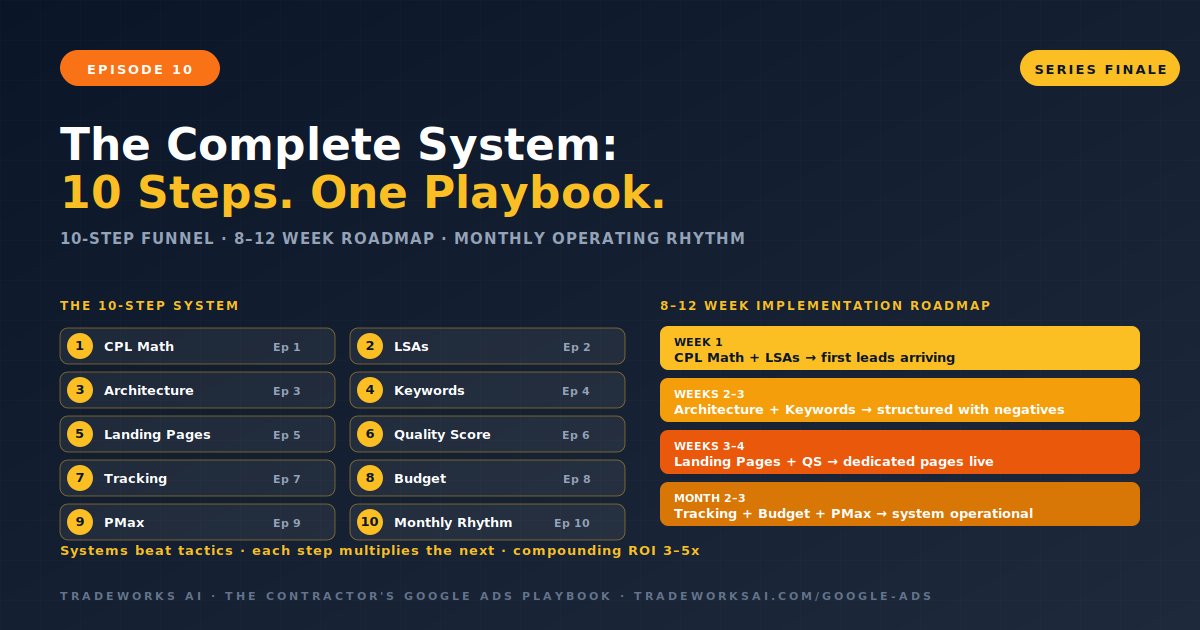
A complete Google Ads system for contractors has 10 components: the CPL-to-Profit Calculator (Episode 1), Google Local Service Ads at $25 to $85 per lead (Episode 2), campaign architecture organized by service line (Episode 3), high-intent keywords with the 200-term Negative Keywords Master List (Episode 4), dedicated landing pages with the 4-element Conversion Formula (Episode 5), Quality Score optimization cutting CPC by up to 50% (Episode 6), 3-layer tracking connecting clicks to paying customers (Episode 7), the 70/20/10 budget allocation matrix (Episode 8), Performance Max as a secondary AI campaign (Episode 9), and the monthly operating rhythm that compounds improvements (Episode 10). Each component multiplies the next. Implementation takes 8 to 12 weeks from zero.
Individual Google Ads tactics produce individual improvements. A better landing page improves conversion rate. A negative keyword list reduces wasted spend. A Quality Score improvement lowers CPC. But the contractor who implements all of them as a connected system experiences compounding returns that far exceed the sum of the parts. A 20% conversion improvement combined with a 30% CPC reduction combined with 25% waste elimination does not produce 75% improvement. It compounds—each improvement multiplies the others, producing 3 to 5x total ROI improvement. This is why the Playbook exists as a 10-episode system. The order matters. The connections matter. The compounding matters.
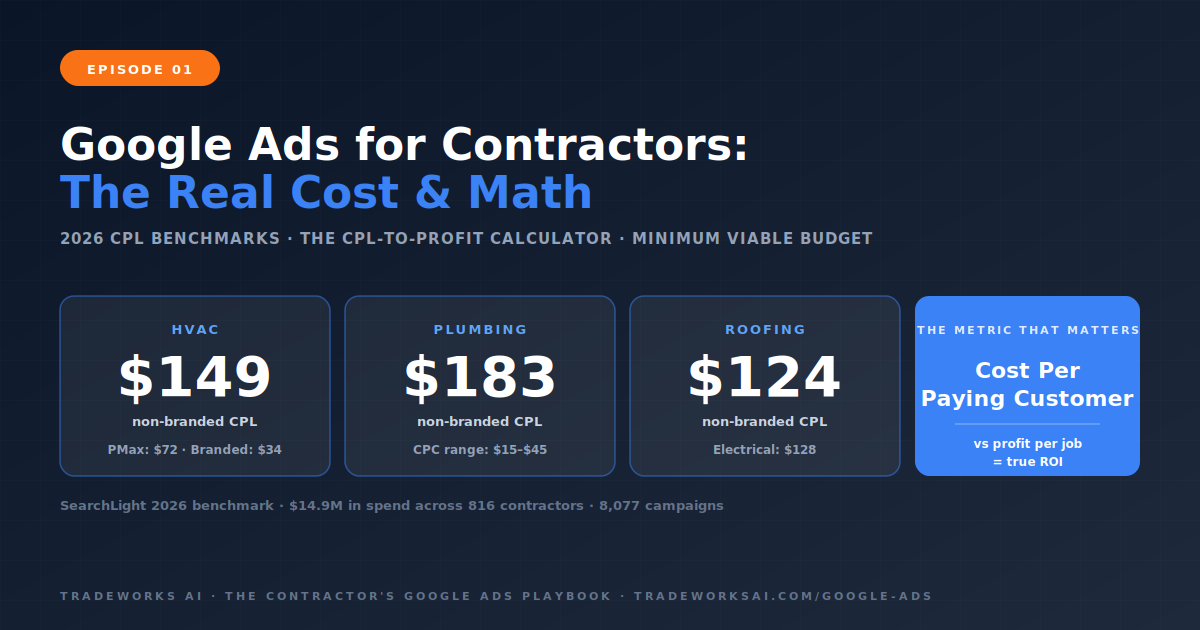
Run the CPL-to-Profit Calculator before spending. HVAC non-branded CPL $149, Plumbing $183, Electrical $128, Roofing $124. Minimum viable budget: $1,500 to $2,500 per month. If the math does not work at your price point and close rate, fix business fundamentals first.
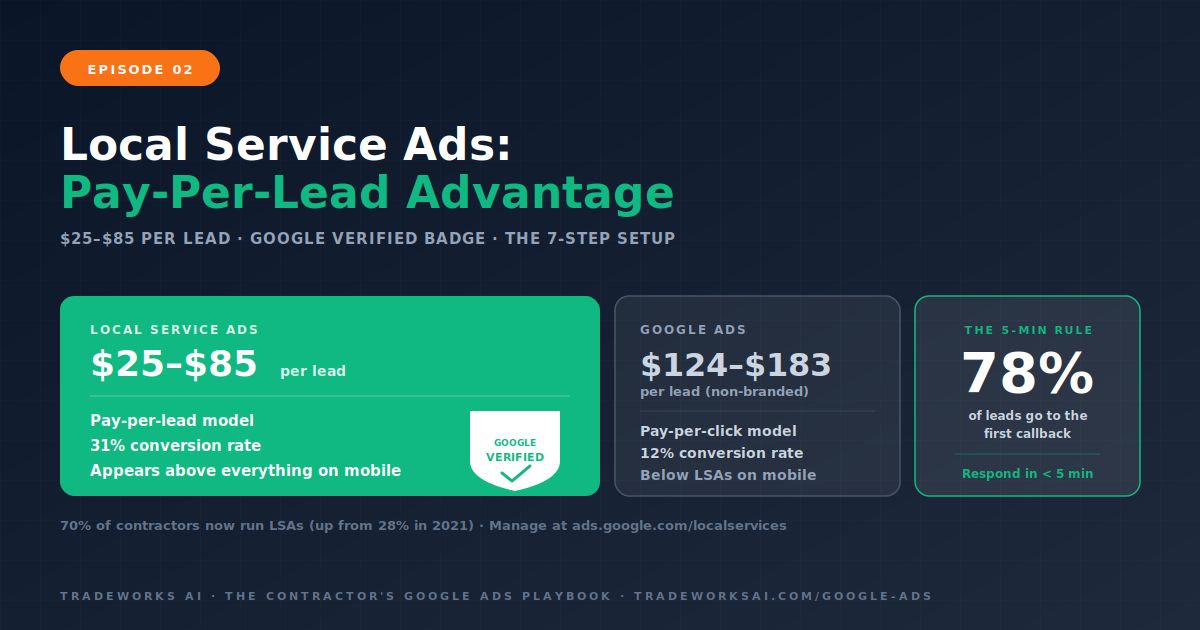
LSAs: Google Guaranteed badge. Pay-per-lead at $25 to $85. 31% conversion rate versus 12% for standard Google Ads. 70% of contractors now run them. The 5-minute rule: 78% of leads go to the first callback. Highest-ROI entry point.
4-layer structure: Branded (5 to 10%), Non-branded service (60 to 70%), PMax (20 to 30% when ready), Remarketing (5 to 10%). Tight Theme Rule within ad groups. Service-line segmentation produces 15 to 25% lower CPL.
15 to 25 high-intent keywords per campaign in exact and phrase match. Negative Keywords Master List: 200-plus terms across 8 categories. Campaigns without negatives waste 20 to 40% of budget. The Monday Ritual: 15 minutes every Monday reviewing Search Terms.
Landing pages convert 2 to 5x better than homepages. $28 CPL on landing page versus $116 on homepage. 4-Element Conversion Formula: message match, trust signals above the fold, single CTA (remove navigation), mobile speed under 3 seconds. One page per ad group.
QS 8 to 10: 37% less per click. QS 4 or below: 64% more. Three components: Expected CTR (40%), Ad Relevance (30%), Landing Page Experience (30%). Fix-it-first framework: check speech bubble icon, fix the Below Average component first. Ad Strength has zero auction impact.
3-layer tracking: Google Ads conversions, CallRail with DNI ($45 to $145/month), offline conversion imports (GCLID flow). 90% of contractor leads are phone calls. ROI Dashboard: 7 metrics monthly. Without tracking, every optimization is a guess.
70/20/10 rule: 70% proven, 20% optimize, 10% test. Budget Allocation Matrix ranks campaigns by cost per paying customer. 5 Scaling Rules: proven campaigns only, 15 to 20% increases, 7 to 14 day wait, diminishing returns monitoring, never scale and change simultaneously. HVAC seasonal: cooling +40 to 60% April through September.
PMax: 45% of Google Ads conversions. HVAC PMax CPL $72 versus $149 Search. Secondary not primary—Search had higher conversion values 84% of the time. Readiness: 30+ monthly conversions, offline tracking, 3x CPA budget, custom video. Brand exclusions before launch.
Weekly: 15-minute Monday Search Terms audit. Monthly: 60 to 90 minute ROI Dashboard review and budget reallocation. Quarterly: full account audit, seasonal adjustments, landing page refresh. The system is self-correcting—tracking reveals problems, the matrix reallocates, the ritual cleans.
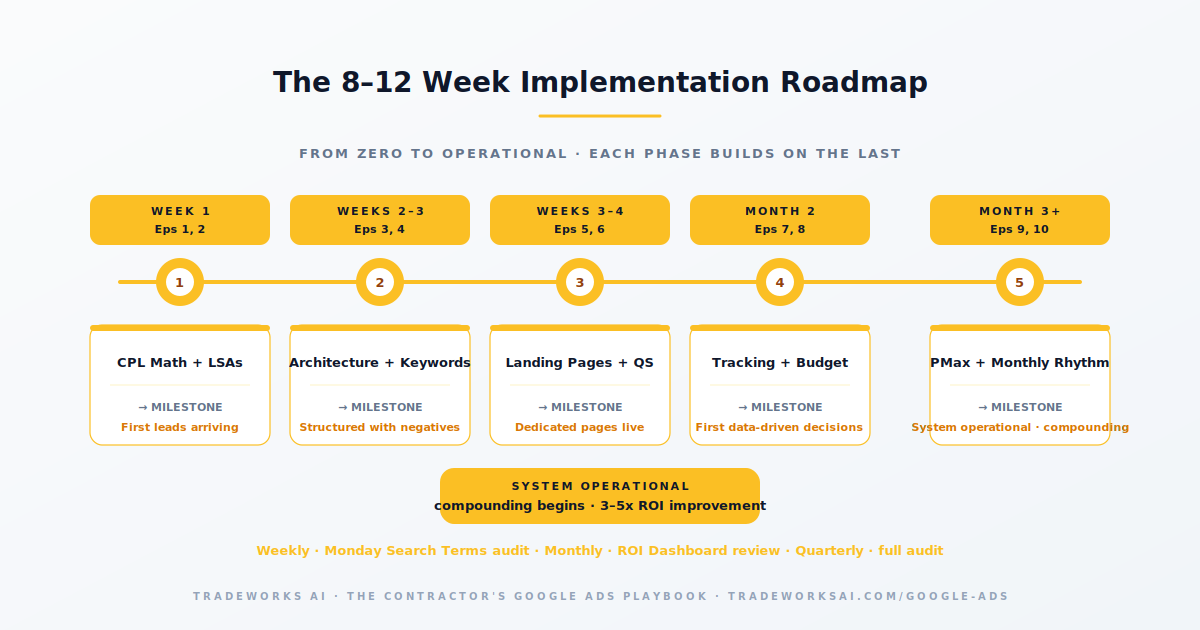
8 to 12 weeks. LSAs and basic Search live in 1 to 2 weeks. Full tracking, landing pages, and budget optimization take 4 to 6 additional weeks. PMax readiness by month 2 or 3.
$1,500 to $2,500/month minimum for Search plus LSAs. Below this, campaigns lack data for optimization. $3,000 to $5,000 enables faster learning and more service coverage.
No. Each step builds on the previous. PMax without tracking optimizes for volume, not quality. Budget optimization without tracking data is guesswork. The order and connections produce the compounding effect.
The Episode 7 ROI Dashboard. Cost per paying customer below profit per job = working. ROAS above 3x = scaling profitably. The dashboard answers the question monthly with data, not intuition.
The difference between a $400 cost-per-customer (profit) and a $700 cost-per-customer (loss) is rarely the bid — it is campaign architecture, landing pages, and tracking. The Google Ads Audit grades your account against the 10-part playbook, identifies the highest-leverage gaps, and shows the one optimization that compounds.
Continue the Google Ads Playbook with Part 1 of 10.
Continue the Google Ads Playbook with Part 2 of 10.