The only Facebook metrics that matter for contractors are the ones that connect to revenue: cost per booked job, Facebook-attributed revenue, and return on ad spend. Everything else, reach, impressions, engagement rate, follower count, is a diagnostic tool that helps you fix problems, not a goal in itself.
A contractor reviewing six numbers once per week for 20 minutes can identify underperforming campaigns, optimize budget allocation, test creative and audience variants, and continuously improve the Facebook marketing system. This is the D (Data and Optimization) component of the DEMAND Engine.
The Weekly Six: Your Facebook Dashboard
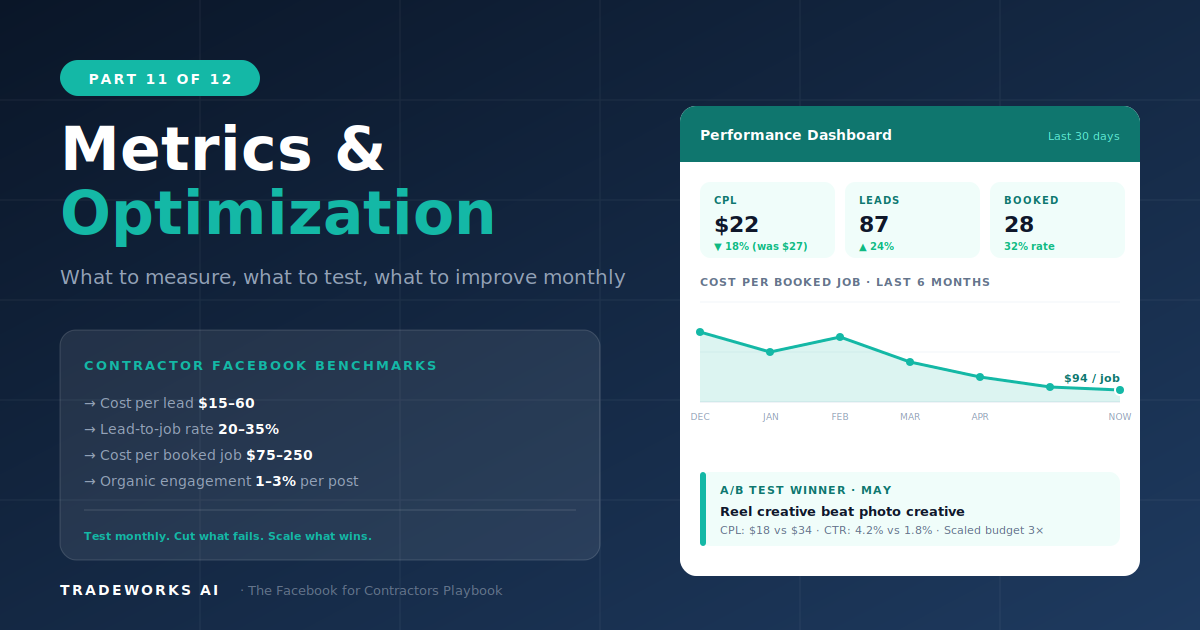
Cost per booked job from Facebook (target $75–250).
Numbers 1 and 2 are outcome metrics. They tell you whether the system is generating revenue. Numbers 3 through 6 are diagnostic. They tell you where to look when outcomes change.
Benchmark Tables: What Good Looks Like
Paid Advertising Benchmarks
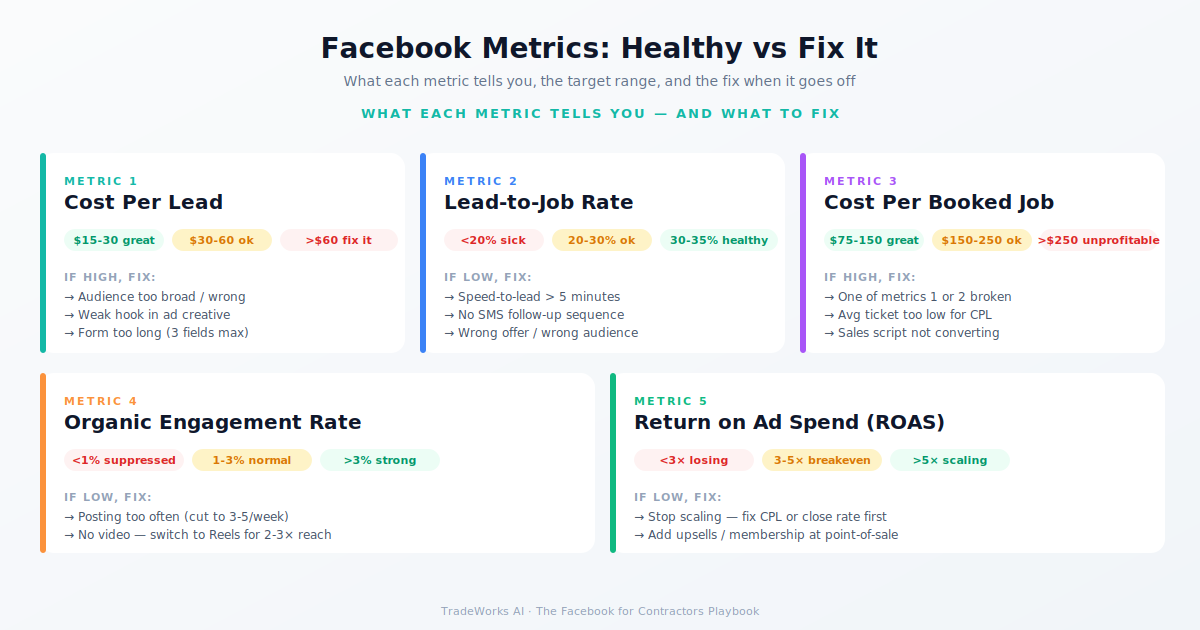
Cost per lead: Healthy $15–30. Warning $30–60. Critical $60+.
Cost per booked job: Healthy $75–150. Warning $150–250. Critical $250+.
Benchmarks calibrated for contractors with 500–10,000 followers in local markets. Initial performance will be at or below warning. The optimization cycle moves metrics from warning toward healthy over 60–90 days.
The Diagnostic Framework
Cost Per Lead Rising
Check creative freshness. Ads more than 3–4 weeks old suffer fatigue. CPL rises 30–50%.
Check audience overlap. Two ad sets targeting similar audiences compete in the auction.
Check ad frequency. 5+ in a week means saturated audience.
Check offer competitiveness. Same offer as competitors? Test different framework.
Check funnel integrity. Lead gen without awareness or retargeting layers is structurally more expensive.
Check lead quality. Did you switch from Higher Intent to More Volume forms?
Check landing experience. Sub-3-second load, form above fold, prominent phone.
Check CSR phone skills. Sometimes declining conversion is not marketing — it is the phone pitch.
Organic Engagement Declining
Check content variety. Same content type for 3+ weeks fatigues audience. Rotate pillars.
Check posting consistency. Gap of 5+ days deprioritizes your page.
Check engagement behavior. Stopped replying to comments? Algorithm reduces distribution.
Check video ratio. Switch 2–3 posts/week to Reels to restore reach.
The A/B Testing Cycle
Testing priority order:
Creative variants within each ad set (3–5 per ad set). Highest impact, lowest effort.
Offer testing monthly. Different framework from the 5 in Part 5.
Audience testing monthly. Lookalike vs interest-based vs behavioral.
Landing page testing quarterly for website-conversion campaigns.
From-name testing once. Owner's name vs company name.
Start with creative testing on every campaign. Facebook's algorithm automatically allocates more budget to better-performing variants within an ad set. You supply the variants, the algorithm finds the winner.
Budget Scaling: When and How to Increase Spend
Scaling prematurely is the most common optimization mistake. Scale only when metrics are in the healthy range consistently for 2+ weeks.
The 20% Rule
When scaling, increase budget by no more than 20% at a time. Wait 3–5 days before next increase. Sudden budget jumps force the algorithm back into learning phase and spike CPL by 30–50%.
Scaling Triggers
Scale up: CPL healthy for 2+ weeks AND lead-to-job 20%+ AND ROAS 4x+. All three.
Hold steady: CPL warning or conversion 15–20%. Test creative, audiences, offers before increasing spend.
Scale down: CPL critical or ROAS below 2x. Reduce 25–50%, diagnose, test fixes, then resume.
Budget Reallocation
If retargeting ROAS is 10x+ and audience not saturated, shift 5–10% from awareness to retargeting.
If awareness CPM is below $10 and video view rates above 30%, awareness is efficient and warrants increased investment.
If one lead gen campaign outperforms another by 50%+ on CPL, shift budget from underperformer to winner.
Attribution: Connecting Facebook to Revenue
Meta Pixel + Conversion API: Tracks website conversions, feeds back to Facebook for optimization.
UTM parameters: Tag every Facebook ad link. Google Analytics shows campaign-level traffic and conversions.
Call tracking: Dedicated phone numbers (CallRail $30–50/month) attribute calls to specific campaigns.
CRM source tagging: Every Facebook lead enters ActiveCampaign with "Source: Facebook — [Campaign]" tag via Zapier.
FSM job tagging: Tag every Facebook-sourced job in your FSM. Monthly, sum Facebook-attributed revenue.
Offline Conversions upload: Monthly upload of booked-job data trains the algorithm on which leads became paying customers.
Monthly ROAS calculation: Total Facebook-attributed revenue ÷ total ad spend. Target 4–10x.
The Monthly Optimization Cycle
1 hour, first Monday of each month:
Review campaign performance. Allocate more budget to top performers.
Kill underperformers. CPL 50%+ above average for 3+ weeks → pause and rebuild.
Refresh creative. Replace any ad creative more than 4 weeks old.
How long before I know if a Facebook campaign is working?
The algorithm's learning phase lasts 3–7 days after launch. Performance is volatile. Do not make major changes during learning. Evaluate after 14 days of consistent delivery for meaningful data. Minimum $100–200 of spend before drawing conclusions.
What is more important: cheap leads or high conversion rate?
Neither. Cost per booked job is the metric that matters. A $15 lead at 15% conversion costs $100/job. A $50 lead at 40% conversion costs $125/job. Always optimize for cost per booked job, not cost per lead in isolation.
How much should I spend on Facebook ads?
Start at $300–500/month for 1–5 trucks. Scale to $750–1,500 at 5–15 trucks. $1,500–3,000+ at 15+ trucks. Scale based on ROAS, not revenue targets. If every $1 produces $5+ in revenue, increase until ROAS drops below 4x.
Should I manage Facebook ads myself or hire an agency?
Start yourself using this playbook. 2–3 hours per week of oversight is enough for most contractors. Consider an agency when monthly budget exceeds $1,500. Use this playbook's benchmarks to evaluate any agency — CPL within healthy range within 60 days is the standard.
What if my Facebook ads produce leads but my office cannot handle the volume?
Capacity problem, not marketing problem. Reduce ad spend to match scheduling capacity. Increase as you add capacity. Overloading wastes ad spend and damages reputation through slow response and missed calls.
How often should I refresh ad creative?
Every 2-4 weeks for retargeting (small audiences fatigue faster) and every 3-5 weeks for cold lead gen and awareness campaigns. Watch the frequency metric: when avg frequency exceeds 5 per week without proportional CPL improvement, the audience has seen the creative enough that fatigue is the bottleneck.
Free Audit
Is Your Facebook Spend Actually Producing Revenue?
Most contractors track impressions and reach, not cost per booked job. Our free audit installs the Weekly Six dashboard, calculates your true ROAS, and identifies the budget reallocation that lifts results fastest.